Priya has repaired laptops from the room above the shop for two years. She has 240 enquiries to show for it, from sixty customers, because most people come back.
She wants one thing from those messages: a guess, made before she quotes, about whether a customer will approve the repair or flinch at the price and go quiet.
So she does what every tutorial says. She writes each enquiry down next to what happened next. She holds back every fifth message, trains a small model on the other four fifths, and scores it on the ones it never saw. Then she rotates which fifth is held back, four more times, and averages the five scores.
The number comes back good. It is also wrong, and the model is not what went wrong.
Her sixty customers sent four messages each on average. When she deals the messages out like cards, a held-out message usually has siblings in the training pile. Take one held-out message: three other messages from that customer exist somewhere, and the chance that at least one of them sits in the 192 rows used for training works out to this.
1 - (47 × 46 × 45) / (239 × 238 × 237) = 0.993
Ninety-nine point three percent. The model is almost never asked about a stranger.
The loop, and the one rule inside it
Cross-validation rests on a small idea. You cannot test a model on the data that taught it, so you take turns.
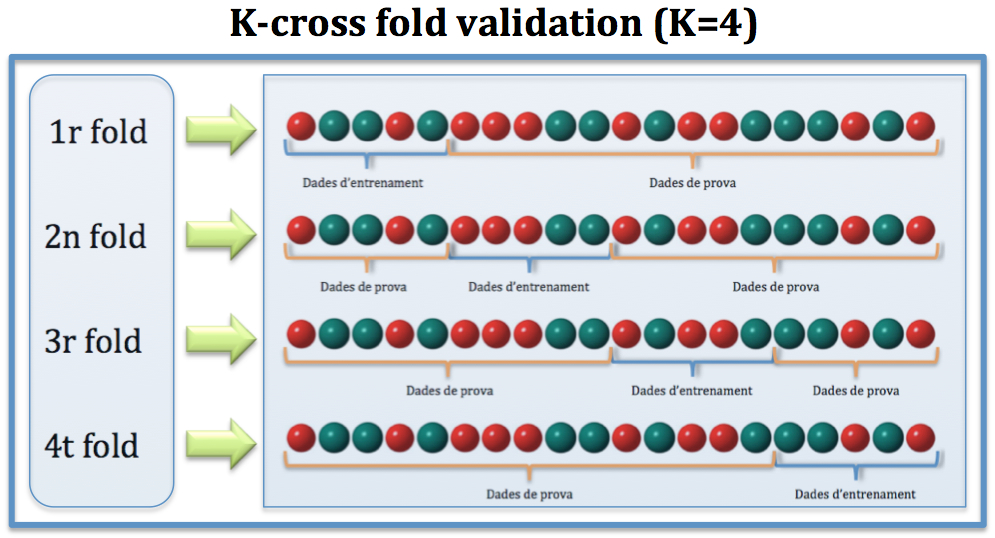
The same data, four times over. Each fold takes its turn as the test set while the other three train, and the four scores get averaged. Image: Joan.domenech91, CC BY-SA 3.0, via Wikimedia Commons.
Five folds means five passes. Forty-eight messages are held out each time, a hundred and ninety-two train, and every message is held out exactly once. The code is four lines.
from sklearn.model_selection import cross_val_score
from sklearn.neighbors import KNeighborsClassifier

scores = cross_val_score(KNeighborsClassifier(3), X, y, cv=5)
print(scores.mean(), scores.std())
The rule that makes those numbers mean anything is smaller than the machinery. Everything the model learns, it has to learn again inside each fold, from the training part only.
Scaling, feature selection, the number of neighbours, the decision threshold, the cleaning steps you chose after looking at the data. All of it belongs inside the loop. Move one step outside and the fold stops being a test.
Why five folds, and not one
A single split gives you one number from one arrangement of the data. Deal the cards again and it moves, often by several points. Averaging five arrangements costs five trainings and buys most of the stability you need.
You could go further and hold out one row at a time. Leave-one-out trains on 239 rows instead of 192, so it squeezes more value from a small dataset, and on paper it is almost unbiased.
It fails in a way worth seeing. Ron Kohavi trained two classifiers over half a million times on real datasets and found that ten-fold stratified cross-validation beat leave-one-out for choosing between models, even when computation was free.
His sharpest example is a trick rather than a benchmark. Take Fisher’s iris, fifty flowers of each of three species, and give it a classifier whose only rule is: predict the most common label in the training set.
On the full dataset that rule scores about 33 percent. Now remove one flower at a time. Remove a setosa and the training set still holds fifty versicolor and fifty virginica, so setosa is no longer the largest class. The classifier predicts the wrong species for that flower, and for every other flower too.
Leave-one-out reports zero percent accuracy for the majority rule on iris.
Then it reports zero variance across the folds, and that is the part that should bother you. The estimate arrives with a confident spread of literally nothing.
When the shuffle lies
One library document says the quiet part out loud. scikit-learn’s guide calls the assumption behind shuffling “Independent and Identically Distributed”, and spells it out: every sample comes from the same process, “and the generative process is assumed to have no memory of past generated samples.”
Priya’s data has memory. Every message remembers the customer who typed it.
The fix is to split on the thing that repeats. GroupKFold takes a column of group ids and keeps each group whole, so a customer’s four messages all land on the same side of the wall.
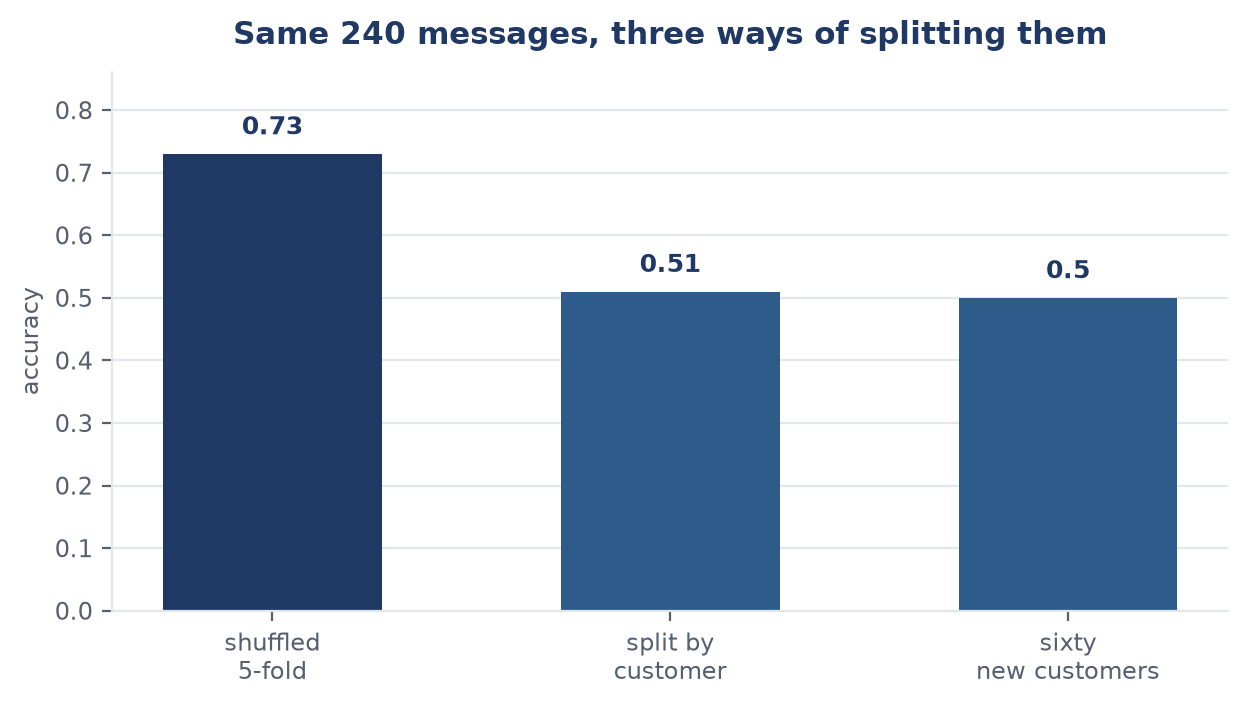
A version of Priya’s problem built to test this: sixty customers, four messages each, a nearest-neighbour model, two hundred repeats of the whole experiment. Shuffled folds scored 73 percent. Splitting by customer scored 51, and sixty customers the model had never met scored 50.
The gap was recognition doing the work, not knowledge. The model had learned to tell one regular apart from another, and a new customer is nobody it has met.
This is not a corner case. In 2023, Sayash Kapoor and Arvind Narayanan surveyed the published reviews and found data leakage in 294 papers across 17 scientific fields. They sorted it into eight kinds. In the civil war prediction literature, where newer models were reported to beat logistic regression outright, they re-ran the comparisons with the leakage removed. The difference in ranking quality between the complex models and the old regression fell from 0.14 to 0.01.
When the shuffle lies twice: time
Time has the same memory problem, in a form shuffling cannot see.
scikit-learn is blunt about it. Classic folds on time series data “would result in unreasonable correlation between training and testing instances”, producing poor estimates, and the right test is always the future observations “least like those that are used to train the model”.
TimeSeriesSplit does this by growing the training window. The first fold trains on January and tests on February. The second trains on January and February and tests on March. Nothing ever runs backwards, so the model never gets to read next week’s news and then predict this week.
The number under the number
Suppose the split is right, the groups are whole and the order is honest. The score is still an estimate from a sample, and a sample has a width.
Gaël Varoquaux measured that width directly. He ran cross-validation on simulated data of known difficulty, then compared the estimate against the accuracy on ten thousand fresh points. At thirty samples, ninety percent of the errors fell within about nineteen percentage points of the truth. At a hundred samples the spread narrowed to nine. At a thousand, to three.
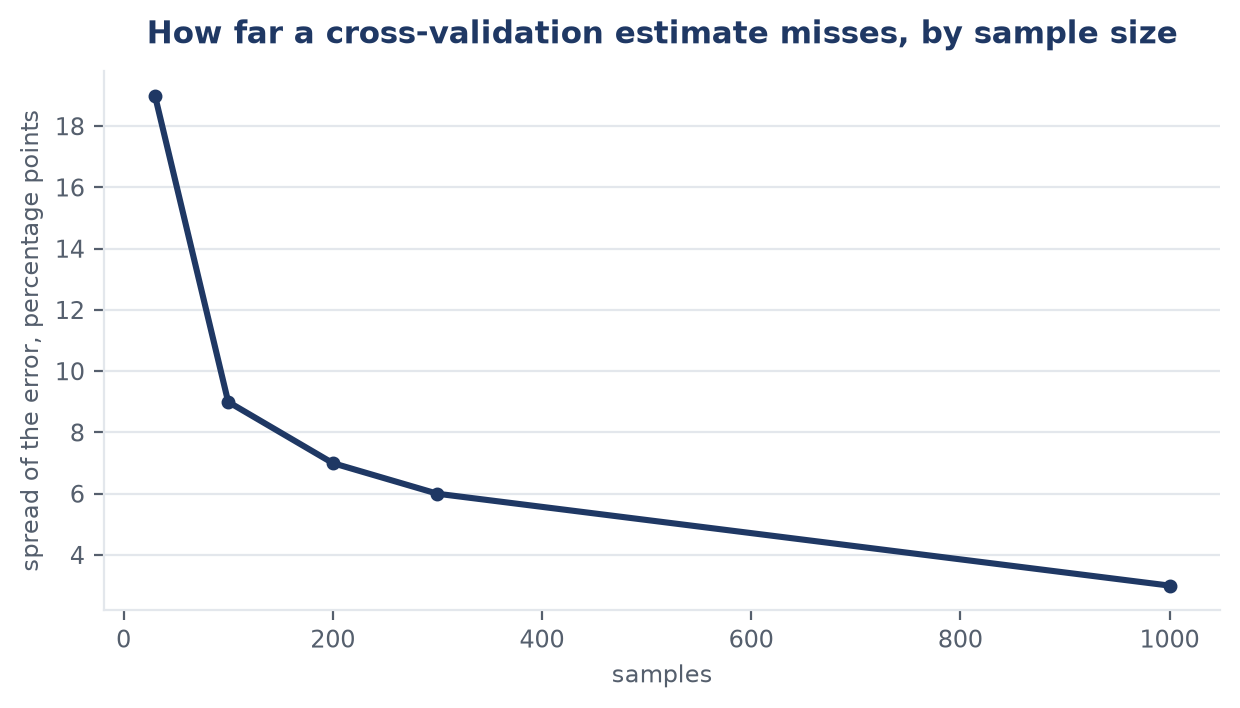
How far a cross-validation estimate misses, from Varoquaux’s simulations: about nineteen points at thirty samples, nine at a hundred, seven at two hundred, six at three hundred and three at a thousand.
The spread you get by averaging across folds does not show this. Varoquaux’s summary is that the standard error across folds “strongly underestimates” the real error, because the folds share a training set and their mistakes travel together.
Some of the width is pure arithmetic, and it belongs to nobody’s model. Predicting a class at 75 percent accuracy, measured on a hundred test items, has a standard deviation of 4.3 points from sampling alone. A 95 percent interval around that 75 percent is 17 points wide. On thirty test items it is 31 points wide.
Real datasets behave the same way. In a Kaggle competition on brain scans of schizophrenia patients, the gap between a method’s score on the public and private test sets ran to about 15 points. And in the civil war re-analysis, one reported ranking score of 0.85 came with a bootstrapped 95 percent interval of 0.66 to 0.95. Nine of the twelve papers they could fully check reported no significance test or uncertainty measure for the comparison.
The folds you tuned on
Here is a subtler leak, and a common one. You run five-fold cross-validation across a grid of settings, pick the setting with the best score, and report that score.
That best score is the maximum of several noisy numbers. Maxima sit above average by construction.
Sudhir Varma and Richard Simon tested this on data where the two classes were identical by design. There was nothing to learn, so a fair estimate had to come out at chance. Tuning by cross-validation and reporting the winning score gave an error under 30 percent on 18.5 percent of the simulated datasets for one classifier, and on 38 percent for another. On genuinely independent data, both did no better than a coin.
Their fix is a loop inside the loop. The inner folds choose the settings, the outer folds measure. That nested estimate came out close to the independent test set for both classifiers. The plain version had been answering a different question: how well does the best of these settings do on the data that chose it.
What to do on Monday
Decide what the score is a promise to, then make the split keep it.
| If this repeats in your data | Split with | The score then describes |
|---|---|---|
| Nothing | KFold, or StratifiedKFold for classes |
a new row like these |
| A person, patient, writer or shop | GroupKFold |
a new person |
| Time | TimeSeriesSplit |
next month |
| Nothing, but you tuned settings | nested cross-validation | a new dataset |
Then hold back one set you touch once, at the end, and report an interval rather than a point.
Back to Priya
Her number was never wrong about her own records. It was answering a question she had not asked: how well can you recognise a customer you have already met, from the messages they already sent you.
The customer at the counter is not that customer. He has never written to her before, and the only thing the model can use is the sentence in front of her.
Keep him out of the training data from the start, and the number you get back is small, unflattering, and about him.